
Greetings again from Carousel Analytics. In this piece, we will take a deeper dive into the relationship between staff continuity and team performance, as measured by efficiency margin. In part 1 (link here) we essentially confirmed conventional wisdom and found that there was a relationship between the two – as staff continuity increased team performance got better. While useful as a way to show how staff continuity and team performance interact with each other, the original approach had some holes in how staff continuity was defined. Specifically, the previous definition treated all amounts of staff turnover the same. The departure of one staff member was treated the same as the departure of two, three, or four staff members.
In order to look more closely at how different levels of staff turnover impact team performance, the previous definition of staff continuity needed to be tweaked. The previous definition started with the first season that a staff was together and looked forward to see how long that staff stayed together without any turnover. Things get more complicated when the goal is to measure how much staff turnover took place between seasons. Instead of only looking forward, it is necessary to also look backward, compare adjacent seasons, and determine how much staff turnover happened between seasons.
One way to conceptualize the change in definitions is to think about a chain vs. a rope. The old definition was basically a chain, and if one link broke then the chain fell apart and lost it’s continuity. On the other hand, the new definition of staff continuity is a rope comprised of many threads. In this case four threads (one head coach and three assistant coaches). If one thread breaks, the rope can still maintain it’s integrity due to the existence of the other three threads. If two threads break, the integrity of the rope is weaker but it can remain intact. So on and so forth, until the final thread snaps and the rope falters, losing all continuity.
By changing the definition of continuity in this manner, we now have four levels of staff continuity look at instead of one. The four levels of staff continuity are as follows:
- Consecutive years that a staff retained at least four core staff members (four staff member continuity)
- Consecutive years that a staff retained at least three core staff members (three staff member continuity)
- Consecutive years that a staff retained at least two core staff members (two staff member continuity)
- Consecutive years that a staff retained at least one core staff member (one staff member continuity)
Note: There is no “zero” staff member continuity because that would essentially include all teams from every season.
The new definition of staff continuity is more layered and a bit more complicated, but the change is worth it because the new definition is much more reflective of how staff turnover occurs in the real world. In addition to illustrating how much turnover happens year to year, it also allows us to see the impact of keeping an entire staff together for consecutive years vs retaining only one, two, or three core staff members per year for consecutive years.
The new definition of staff continuity, while better, is still not perfect. The biggest issue with the new definition is that it treats turnover at the head coach position and assistant coach positions the same. Parsing out the impact of change at those positions would be beneficial, and is the obvious next step in this line of work. However, it will not be addressed in this piece.
In order to compare things apples to apples a few criteria, outlined below, were applied to filter out teams that weren’t quite comparable to other teams for one reason or another.
- This data only includes the results from Division 1 Men’s basketball teams that competed from 2007-2008 through 2019-2020.
- Only core staff (Head Coach and Assistant Coaches) were included..
- Staffs with more than four core staff members were not excluded. If a staff had more than four coaches return, they were included in the group with at least four staff member continuity.
- Internal promotions were treated as staff turnover. For example, if a head coach left and was replaced internally by an assistant coach, whose spot was then filled by a new assistant coach, that staff would be grouped with two staff member continuity (not three).
- Not a criteria, but just to be clear the title “Associate Head Coach” was combined with “Assistant Coach”.
Keep in mind how the data was collected. This dataset includes the entire coaching history for every head and assistant coach in Division 1 Men’s basketball since the 2007-2008 season. Some coaches have been around for a very long time. Even though this data only shows outcomes for the 2007/2008 through 2019/2020 seasons, the staff continuity data goes back many, many more years. Thus staff member continuity using the new definitions can stretch back nearly 60 years.
After all of these criteria were applied there were 4486 unique seasons worth of data, across 13 seasons, to use for this analysis.
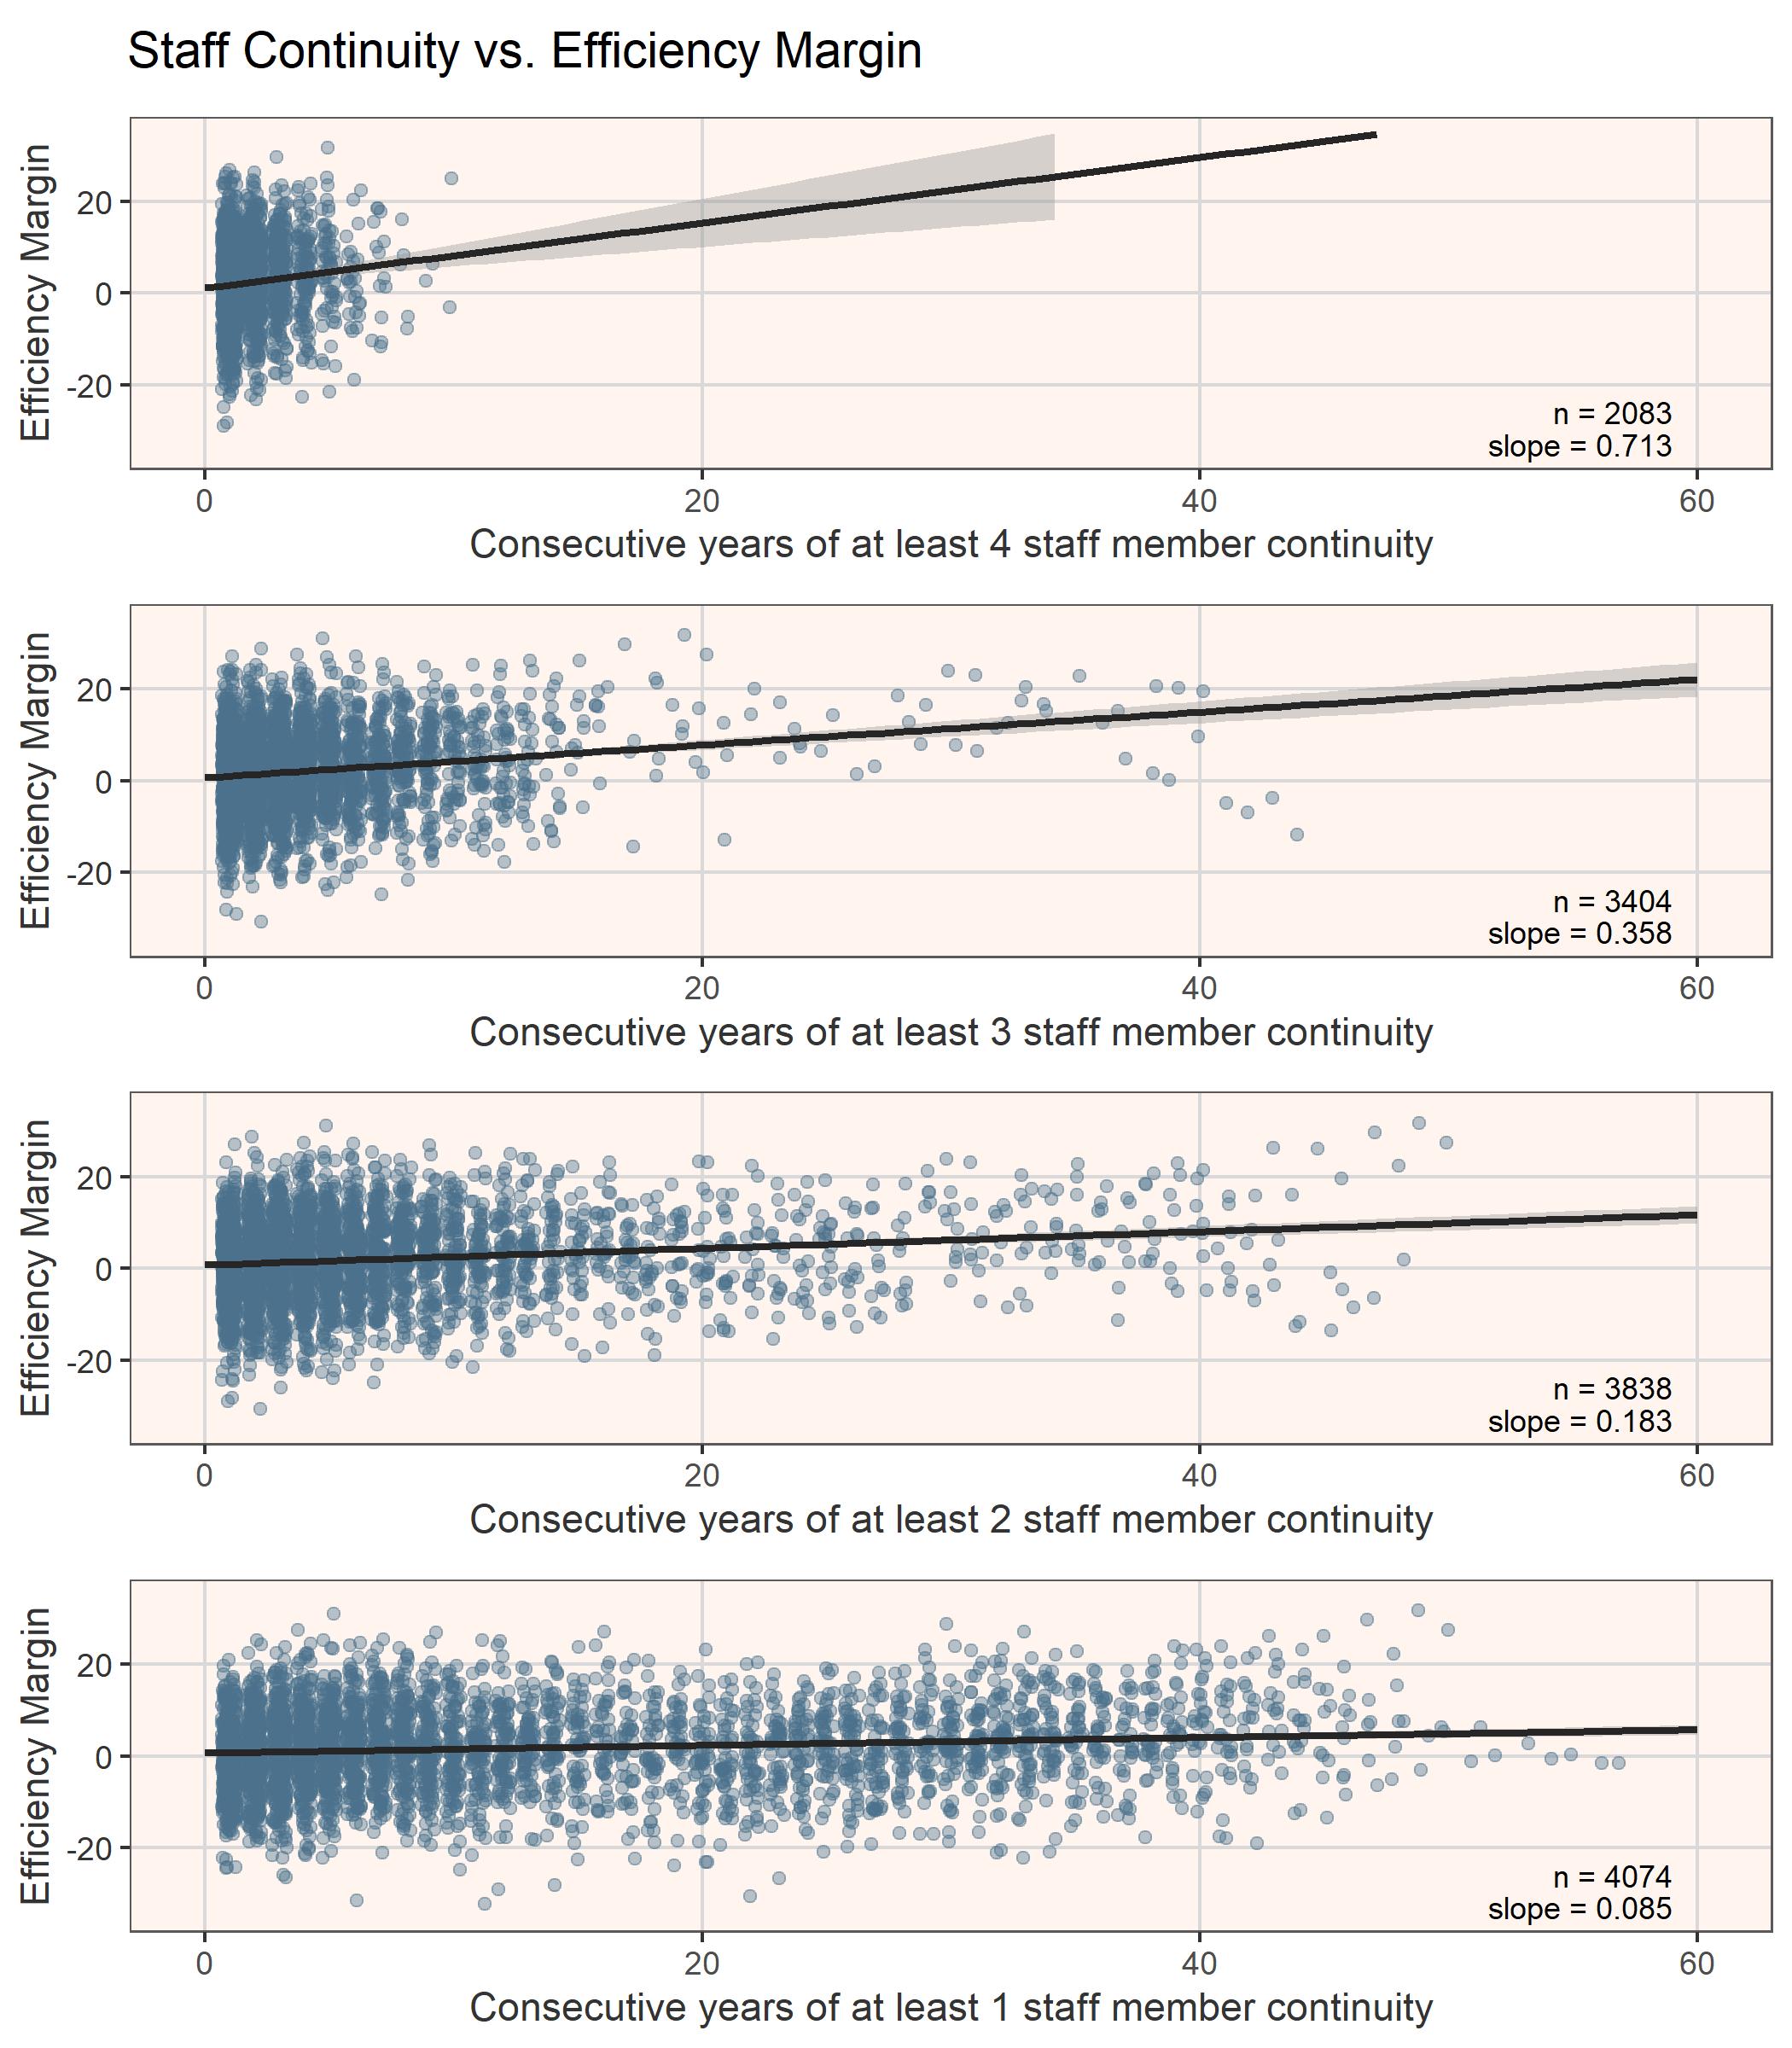
Now, let’s dig in to some actual data. Figure 1, below, shows the impact of staff member continuity on efficiency margin. The top graph shows the relationship for consecutive years of four staff member continuity, working down to one staff member continuity on the bottom. Each dot represents a single team’s season. In order to help with visual comparisons the x-axis on each chart was kept constant.
(Click to expand on phone)
First, focus on the number of observations within each level of staff member continuity. As the level of staff member continuity becomes less strict, more teams fit the each definition. Looking at four staff member continuity, there are 2083 observations, while three staff member continuity has 3404 observations. The number of observations gets larger with each level of staff member continuity, though the rate of increased observations tapers off.
Big picture, the impact of consecutive years of staff continuity is stronger at the higher levels of staff member continuity. To see this at a glance, look at the slope of the black regression line on each graph of the four graphs in figure 1. A steeper (larger) slope indicates more impact of continuity on team performance. For example, looking at four staff member continuity (top graph), a slope of 0.713 means that each year of four staff member continuity results in an increase of 0.713 in efficiency margin. Meanwhile, three staff member continuity (second graph from the top) shows a slope of 0.358, a smaller increase in efficiency margin for each year a staff stays together with at least three core members remaining on staff.
Within each of the four levels of staff member continuity, the relationship between staff member continuity and efficiency margin was significant (p<0.05). That said, on a practical level the impact of one staff member continuity is extremely low (slope = 0.085). While significant, that is not very impactful in the real world. To put that number in to context, one year of four staff member continuity results in the same increase in efficiency margin as nine years of one staff member continuity. It is also interesting to note that the slope decreases by roughly ½ for each step-down in staff member continuity.
The main question here, however, is whether there is a difference between any of the staff member continuity levels. In short, yes. There is a significant difference between each of the staff member continuity levels. Keeping all four staff members together for a long period of time is not only significantly related to a higher efficiency margin, but also significantly better than keeping at least 3 members of a staff together for a long period of time (p=0.02). This comparative relationship remains true for all four levels of staff continuity.
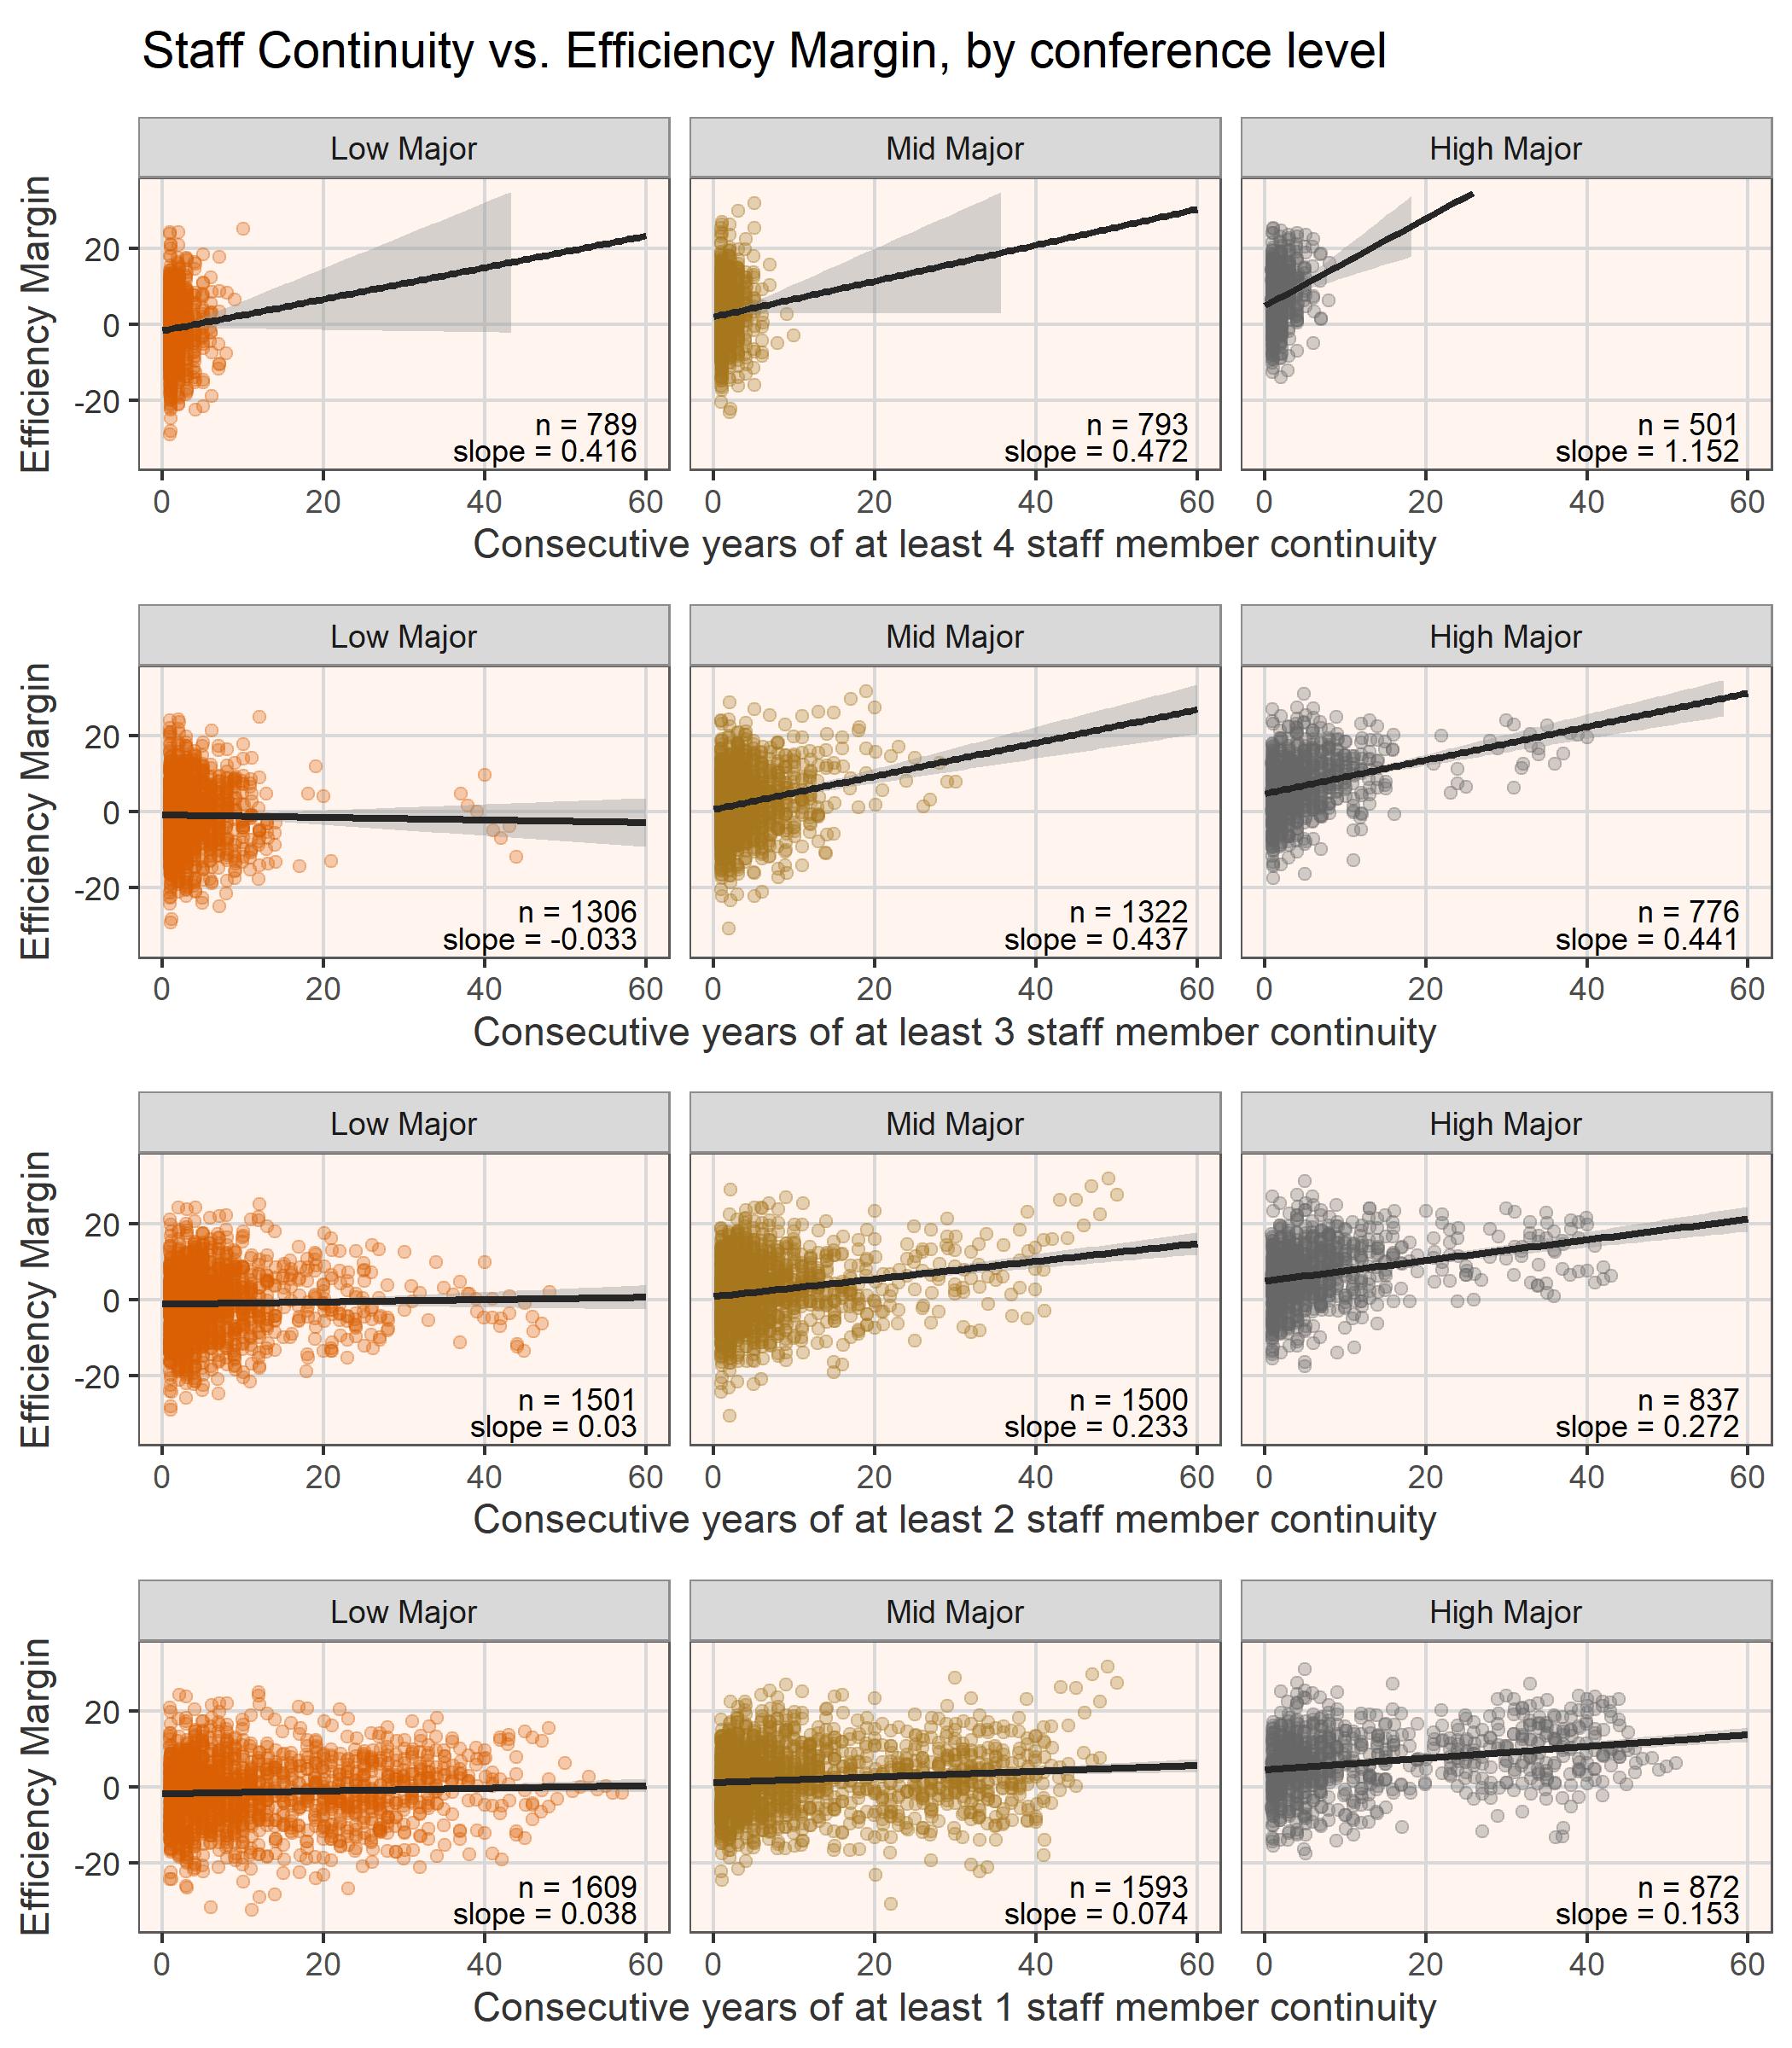
Taking this one step further, it is interesting to look at how these trends play out when the levels of staff continuity are broken down by conference level (low, mid, and high major). Very broadly speaking, we see the same trends as outlined above. However, consistent with what was shown in Part 1, low major conferences seem to behave differently than mid and high major programs . See figure 2 below.
(Click to expand on phone)
Looking at four staff member continuity there is a good relationship between staff continuity and efficiency margin across all conference levels. Low and mid major programs have a slope of 0.416 and 0.472, respectively. Meanwhile, high major programs have a much higher slope of 1.152. Across all three conference levels, maintaining four staff member continuity is associated with improved efficiency margin.
Dropping down to three staff member continuity, things change a bit. For low major programs, there is no noticeable relationship between staff continuity and efficiency margin (slope = -0.033). Meanwhile, mid major programs maintained roughly the same slope as before (0.437), and the slope for high major programs decreased quite a bit (0.441).
Moving on to two and one staff member continuity, the same trends as above are seen. There doesn’t appear to be a relationship between continuity and efficiency margin at the low major level. Mid and high major conferences do see a relationship between continuity and efficiency margin, though the strength of that relationship continues to weaken as the level of staff member continuity decreases.
Again, the main question we are looking at here is whether a higher level of continuity (ie, four staff member continuity) is better than a lower level of continuity (ie, three staff member continuity), this time breaking things down by conference level.
Starting at the low major level, there is no significant difference between any of the levels of staff member continuity. The difference between four and three staff member continuity was very nearly significant (p=0.55) but did not quite dip below the significance threshold of 0.05. Mid major conferences did not show a significant difference between four and three staff member continuity, but did show a difference between all other levels of continuity (four vs. two, three vs. two, etc…). Once again, the biggest differences were seen at the high major level. When only looking at high major conferences, each level of staff member continuity was significantly different from every other level of staff continuity.
So, what are the big takeaways, and how can this information inform decision making during the coaching carousel? Big picture, increased levels of staff continuity are related to better on-court performance, though the level of impact is different when taking conference level in to account.
Staff turnover is a given. It is inevitable. Being prepared and having a plan to deal with turnover is paramount. Who are you willing to let walk at the end of each season? Who are you prepared to fight to keep? Some turnover may be good. Four staff member continuity in and of itself does not guarantee success. If a staff member is not a good fit then there is no benefit in retaining them just for the sake of continuity. Likewise, there may be times where it makes sense to make a staff change in order to bring in a new staff member who is obviously an upgrade. This sort of context is important to consider on a case-by-case basis. In general, as a guiding principal, keeping a staff together is a good thing – particularly at the high major level.
As has been seen in this data before, low major programs behave differently than mid and high major programs. At the low major level, there may be some benefit to focusing on four staff member continuity when possible, but the impact is at best borderline significant. Otherwise, there is no significant benefit in spending resources to keep your staff together for a long period of time.
At the mid major level, maintaining at least three staff member continuity is significantly better than maintaining two or one staff member continuity. Putting this into practice, if there is an off-season where two coaches have the opportunity to leave your mid major program, it may be worth spending a little extra cash to keep at least one of them for one more season to maintain 3 staff member continuity. Then you can revisit your staff the following off-season to see if you can withstand that coach departing for greener pastures.
For high major conferences, every ounce of staff member continuity that you can maintain is associated with better performance on the court. Maintaining four staff member continuity is hugely impactful, even compared to three staff member continuity.